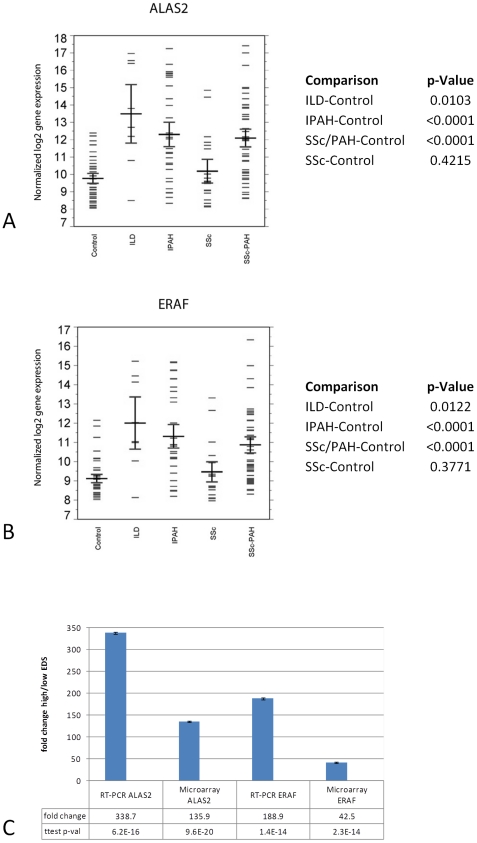
Figure 6. Statistically significant differential expression of erythroid CD71+ specific genes.
A) ALAS2 and B) ERAF/AHSP genes in hypertension groups (SSc-PH-ILD, IPAH, and SSc-PAH) versus healthy controls and scleroderma (SSc). The box plots give the mean (horizontal black line), sample values (short blue lines), and 84% confidence interval (CI) (red lines) for each group, (non-overlap of the 84% CIs of two groups is an approximate indicator of significant difference between their means at the 0.05 level of significance). C) Individual ALAS2 and ERAF gene expression microarray results were validated by RT-PCR for high and low EDS patients across all hypertension classes (SSc-PAH, IPAH, SSc-PH-ILD).
Further inspection of the EDS gene list also showed the inclusion of genes for both the GATA1 and KLF transcription factors which are both essential for erythroid development [28,29]. A test by gene set analysis of the entire dataset comparing each PH group directly versus the SSc group as the baseline group showed a significant and specific enrichment among genes which contain three different GATA transcription factor binding sites in their upstream promoter regions (TRANSFAC [30]) (Figure 7A). Interestingly, the genes up-regulated in each of the GATA transcription factor binding site gene sets were mostly non-overlapping either with each other (an average of 59–62% unique genes for each gene list) or with the EDS gene expression signature itself (95% unique non-overlapping genes) (Figure 7B) indicating that the effects of elevated GATA1 gene expression are both pervasive in the PH groups and are supplemental to the EDS gene expression signature itself. The observation that downstream regulatory events are related directly to EDS elevation (through the up-regulation of the GATA1 transcription factor gene) and are associated with PH groups, taken together with the previously demonstrated strong association of the EDS with reticulocyte maturation (Figure 5), led us to the identification of this signature as the Erythroid Development Signature (EDS).

