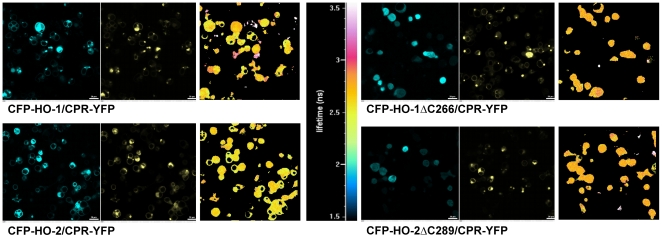
Figure 7. FLIM measurements of CFP-HOs with CPR-YFP in HEK293 cells.
Pictures of the HO-CPR co-transfections were made in the CFP channel (left panels) and YFP channel (middle panels). The right panels show the color coded lifetime of the donor CFP. The corresponding color scale is shown in the center of the figure. The white bars correspond to 20 µm.

