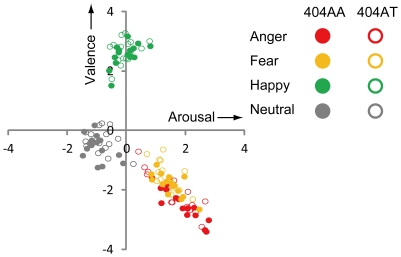
Figure 4. Plots in 2-dimensional affective space of valence-arousal. Each point indicates average raw scores of all 404AA subjects (n = 88, filled circles) or all 404AT subjects (n = 34, open circles) for each stimulus picture.
The plot was made according to the methods of Bradley and Lang [26], and Lang and Davis [27].

