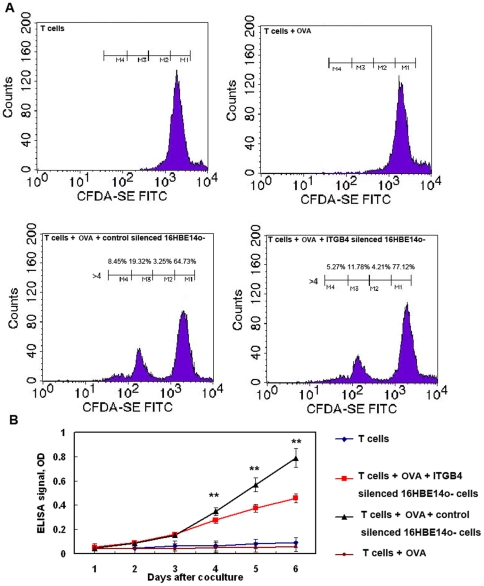
Figure 4. T cell proliferation was observed after coculturing T cells with control transfected 16HBE14o- cells or ITGB4-silenced cells.
(A) On the basis of decreased CSFE staining, T cell proliferation are shown as percentage of proliferating cells, and are representative of one experiment repeated six times. Percentage of dividing cells (cells that have undergone 1 division) is shown for control silenced 16HBE14o- cells +T cells and ITGB4 silenced 16HBE14o- cells +T cells cocultures. Proportion of original population induced to divide after stimulation was determined by measuring the number of events in each cell division. (B) Meanwhile, T cell proliferation was assessed by a BrdU incorporation assay after coculture. The data are expressed as the mean (±SEM) values of the specific absorbance from 10 independent experiments.

