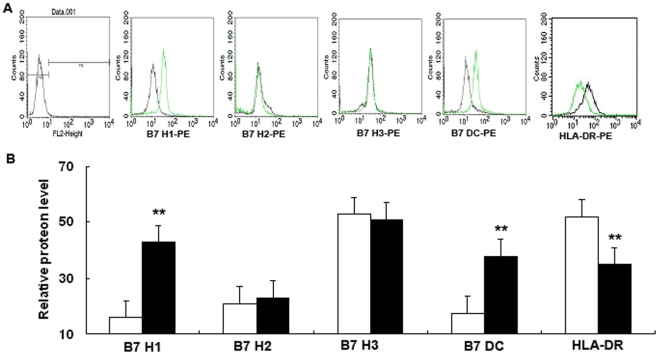
Figure 7. Flow cytometric analysis of cells surface expression of HLA-DR and B7 homologs in 16HBE14o- cells after ITGB4 silencing.
(A) Cells from different groups were stained with specific antibodies to indicate HLA-DR and B7 homologs expression as described in materials and methods. The histograms shown are from a representative results of six independent experiments are shown. (B) The mean relative fluorescence intensity of B7 homologs was quantified after ITGB4 silencing.

