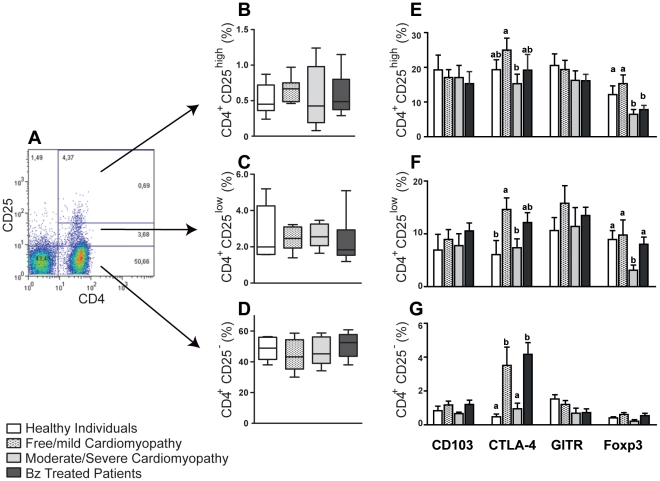
Figure 3. Characterization of CD4+CD25+ Treg in patients with different clinical manifestations of Chagas disease.
Representative flow cytometry analysis of CD4+CD25high, CD4+CD25+Low, CD4+CD25− gated lymphocytes is shown in A. PBMC from control and Chagas' disease patients in these analyses were gated on lymphocytes via their forward (FSC) and side scatter (SSC) properties, and CD4+CD25high (B), CD4+CD25+Low (C), CD4+CD25− (D) were performed to determine the regulatory T cell population. CD4+CD25high (E), CD4+CD25+Low (F), CD4+CD25− (G) cells were analyzed for their expression of membrane CTLA-4, GITR, CD103, and intracellular Foxp3. PBMC (5×10⁶ cells/mL in a 48 plate well) from Chagas' disease patients were cultured with trypomastigote antigen (10 µg/mL) after 48 h of antigenic stimulation the expression of surface markers (CD4, CD25, CD103, CTLA-4, GITR) and transcriptional factor (Foxp3) were determined. The results are expressed as means ± standard errors. a and b indicate statistical differences with P<0.05.

