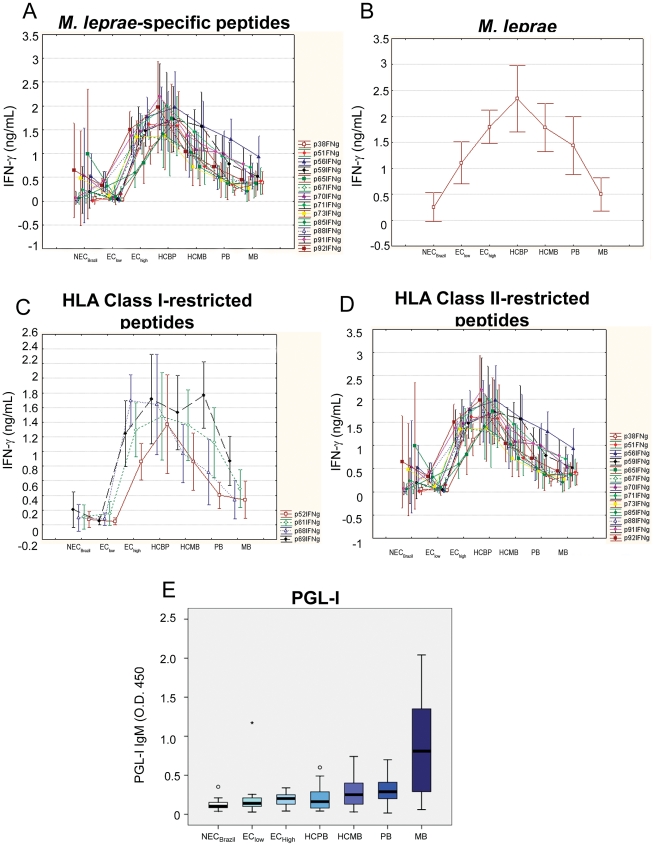
Figure 5. Level of exposure to M. leprae and response to the bacillus or M. leprae-specific peptides.
Medians of the IFN-γ levels induced by M.leprae-specific peptides (A, C, D) or sonicated M. leprae (B) are shown for groups displayed in increasing order of exposure to M. leprae from left to right in the “x” axis. Detection of IgM anti-PGL1 in sera was performed using a specific ELISA (E).

