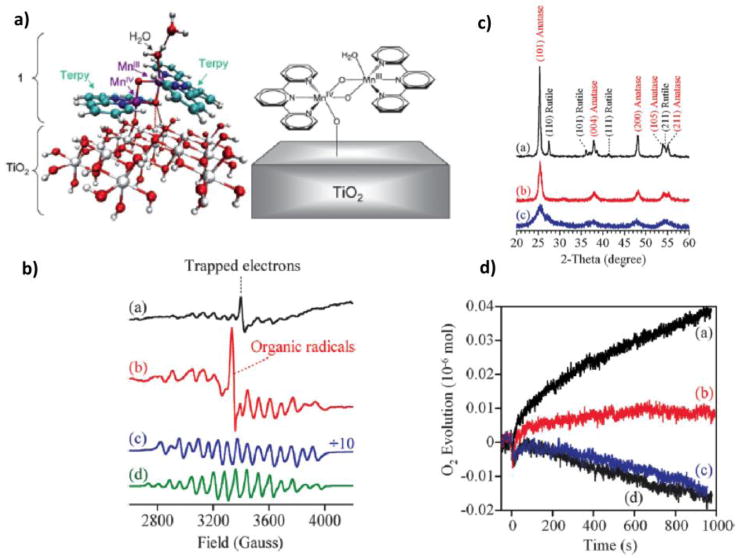
Fig 4.
Panel a: DFT/QM-QMM model of the complex 1 anchored to a TiO2–NP, with a water ligand exchanged by the NP. Color scheme: C (lightblue), H (white), Mn (purple), N (blue), O (red), Ti (gray). Panel b: EPR spectra of (a) 1–P25, (b) 1–D450, (c) 1–D70, and (d) complex 1 in a HOAc/NaOAc buffer solution (pH 4.5) is also shown in the figure (d). A trapped electron signal and an organic radical signal are present in spectra (a) and (b), respectively. Panel c: Powder XRD patterns of (a) P25, (b) D450, and (c) D70 indicating different crystallinity of these TiO2 nanoparticles. Panel d: O2 evolution using Ce4+ as a single-electron oxidant. 1 was loaded on TiO2 (50 mg) samples: (a) P25, (b) D450, and (c) D70; and control test using (d) bare P25 NP’s as the catalyst. Reproduced from Ref. 37.

