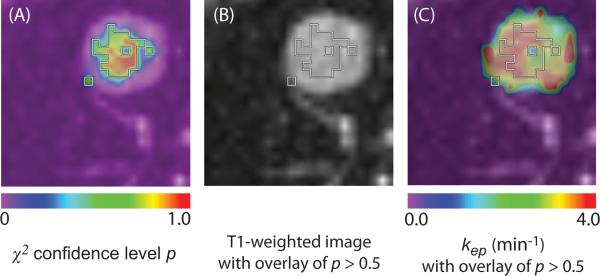
Figure 2.
Representative parametric maps of tumor area in the same case from Figure 1. (A) Goodness-of-fit map color-coded according to confidence level of χ2 test overlaid on a T1-weighted image. (B) Boundaries of voxels with more than 50% confidence level of χ2 test are superimposed on the T1 image. (C) Color-coded kep map. The map shows kep values of the entire tumor area. kep values within the boundaries of panel B was used for the evaluation. The isolated voxel at the edge of the tumor is a single voxel.

