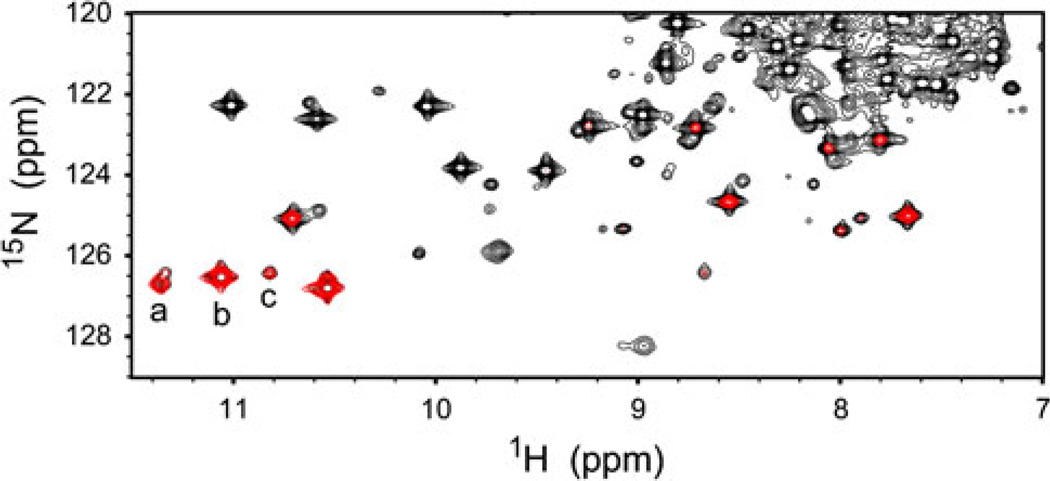
Fig. 3.
Portion of 1H–15N heteronuclear single quantum coherence spectra collected 5 h after substoichiometric reduction of a Synechococcus Fe(III)GlbN-R sample (GlbN-R is GlbN with noncovalently attached heme). Black conventional flip-back WATERGATE spectrum, red band-selected spectrum. Cross peaks a, b, and c are from Thr80 HN in Fe(II)GlbN-A, Fe(III)GlbN-A, and Fe(III)GlbN-R, respectively

