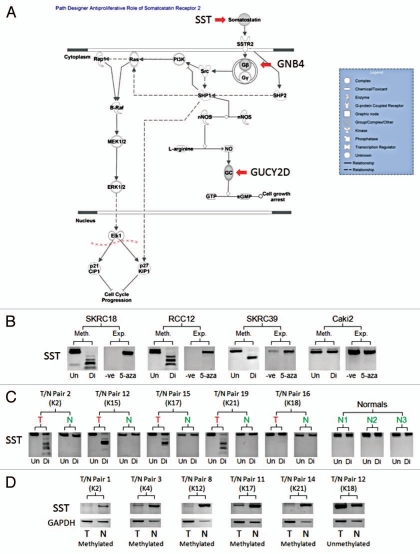
Figure 4.
Methylation Analysis of SST. (A) The anti-proliferative role of Somatostatin Receptor 2 pathway demonstrated to be enriched for by the combined analysis selected gene set using Ingenuity® Systems Pathway Analysis Software (www.ingenuity.com). The selected genes are marked on the pathway. (B) Demonstrates the methylation status of example renal cell carcinoma cell lines (Un = undigested, Di = digested) in comparison the mRNA expression of the relevant gene before and after 5-Aza-2′-deoxycytidine de-methylating treatment (-ve = no treatment, 5-aza = de-methylating treatment). (C) Examples of tumor/associated normal (T/N) CoBRA pairs (numbered 1–20) showing tumor specific/enriched methylation in tumors and no methylation in normal kidney samples and certain tumors (Un = undigested, Di = digested). (D) Demonstrates the loss or depletion of methylated SST gene mRNA in tumor/associated normal (T/N) mRNA pairs (numbered 1–15). Kidney tumor (K) numbers were added to compare CoBRA and mRNA T/N pairs.

