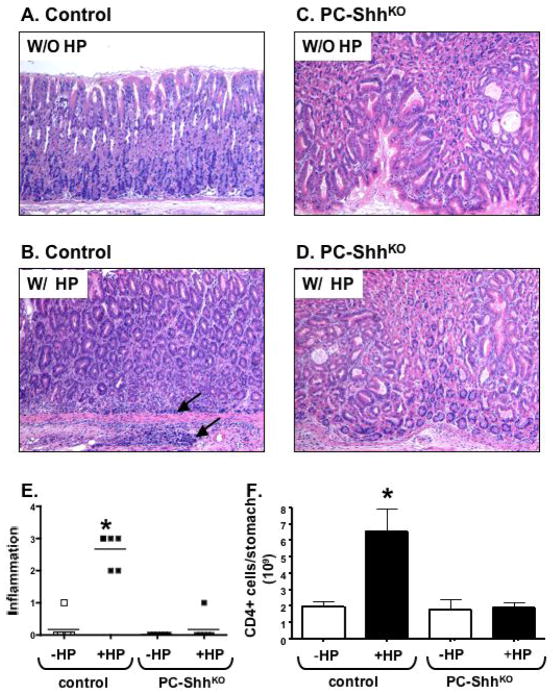
Fig. 1. Analysis of inflammation in H. pylori infected control and PC-ShhKO mice.
Representative H&E-stained sections of inflamed stomach from control mice (HKCre or Shhflx/flx) inoculated with (A) media (W/O HP) or (B) W/ HP, and or PC-ShhKO mice inoculated with (C) media (W/O HP) or (D) W/ HP. Area of inflammatory infiltrate is shown in the stomachs of infected control mice (arrow). Images captured at 10X magnification. (E) Histological score was graded on inflammation (neutrophil and lymphocytic infiltration). A score of 1=5–25%, 2=26–50%, 3=51–75% and 4=76–100% of the total mucosa. Each data point represents the histological score given for an individual animal. CD4+ T cells were analyzed by flow cytometry and expressed as the number of cells in the gastric mucosa per mouse in uninfected and H. pylori infected control and PC-ShhKO mice. W/O HP: without H. pylori infection, W/ HP: with H. pylori infection, *P < 0.05 compared to uninfected group as analyzed by two way ANOVA, n = 5–8 animals/group.

