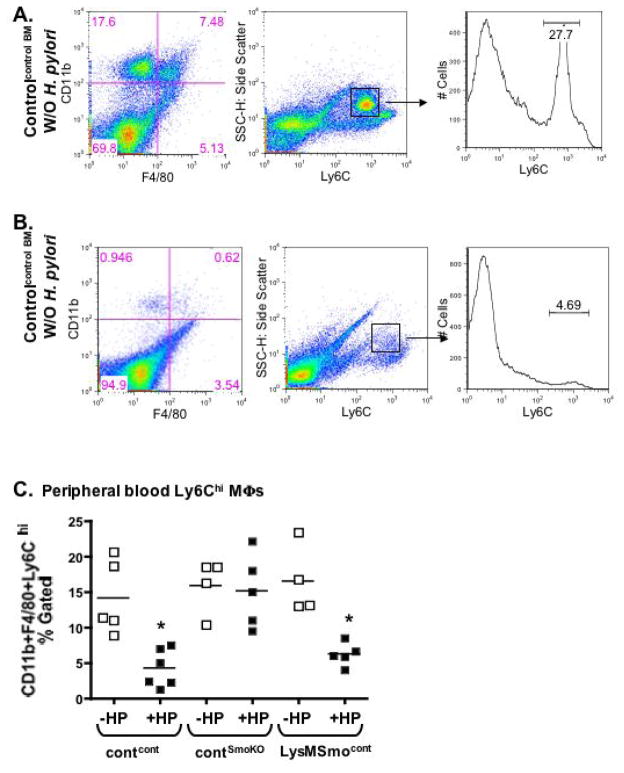
Fig. 6. Changes in peripheral macrophage number in response to H. pylori infection.
Flow cytometric dot plots showing changes in CD11bhighF4/80highLy6ChighLy6Glow cell distribution in peripheral blood collected from control recipients transplanted with control donor (contcont) (A) without H. pylori (W/O H. pylori) or (B) with H. pylori (W/ H. pylori) infection 2 days post-inoculation. (C) Quantification of peripheral CD11bhighF4/80highLy6ChighLy6Glow cells collected from control recipients transplanted with control donor (contcont) or LysMCre/SmoKO donor (contSmoKO) bone marrow cells and LysMCre/SmoKO recipients transplanted with control bone marrow cells (LysMSmocont) without H. pylori (−HP) or with H. pylori (+HP) infection. n = 4–8 per group, *P < 0.05 compared to uninfected analyzed by one-way ANOVA.

