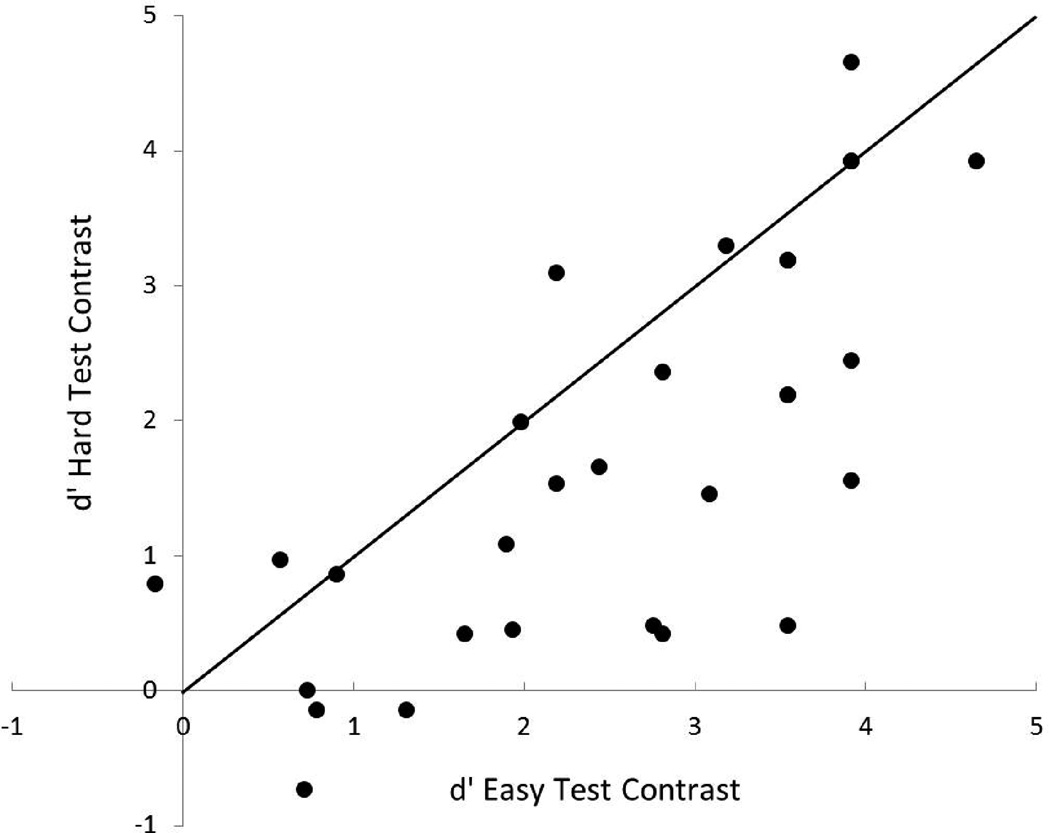
Figure 3.
Scatterplot of individual performance on the perceptually easy (/bu/ vs. /ba/) and hard (/sa/ vs. /∫a/) test contrasts. The diagonal line displays what would be expected if performance were equivalent on the perceptually easy and hard contrasts. Note that there were 3 pairs of participants who had identical scores on the perceptually easy and hard contrasts, explaining why only 27 data points are plotted in the figure.

