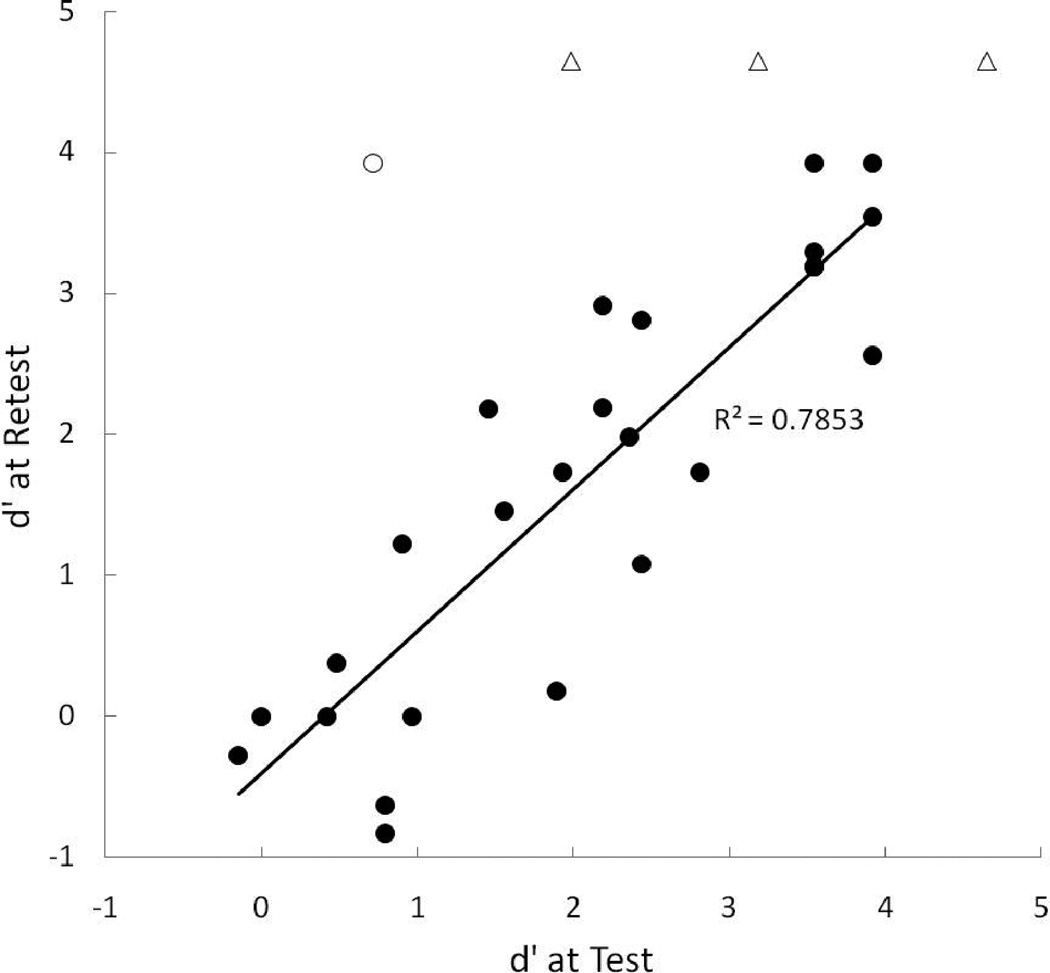
Figure 7.
Scatterplot of individual test and retest scores. The unfilled triangles display data from three toddlers who scored at ceiling at test and/or retest and the unfilled circle represents a single participant who had a 4-month delay between test and retest. The regression line was calculated with data from the toddlers who scored at ceiling and the child with the long test-retest delay excluded from the analysis.

