
Figure 2.
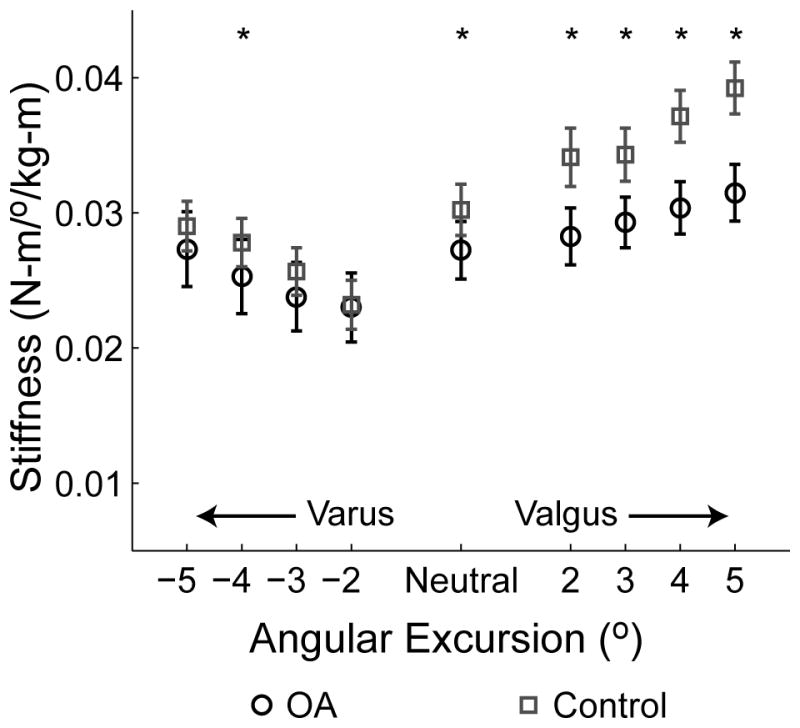
Normalized frontal plane stiffness as a function of angular excursion. *Stiffness was significantly less (P<0.05) in the OA group compared to the control group. Error bars represent standard error.
Official websites use .gov
A
.gov website belongs to an official
government organization in the United States.
Secure .gov websites use HTTPS
A lock (
) or https:// means you've safely
connected to the .gov website. Share sensitive
information only on official, secure websites.
Normalized frontal plane stiffness as a function of angular excursion. *Stiffness was significantly less (P<0.05) in the OA group compared to the control group. Error bars represent standard error.