
Fig. 5.
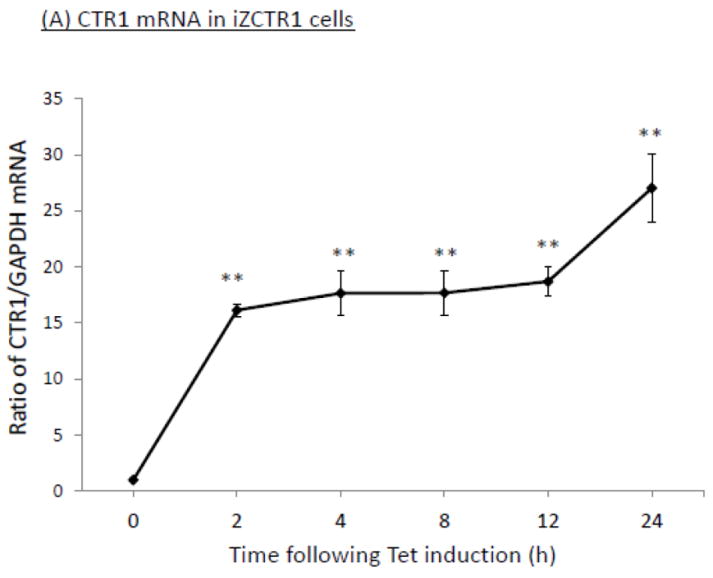
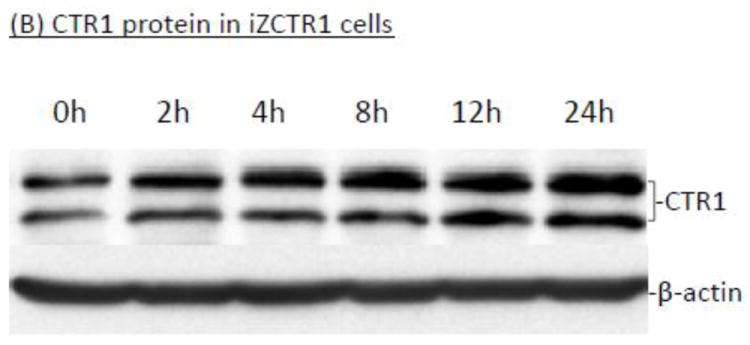
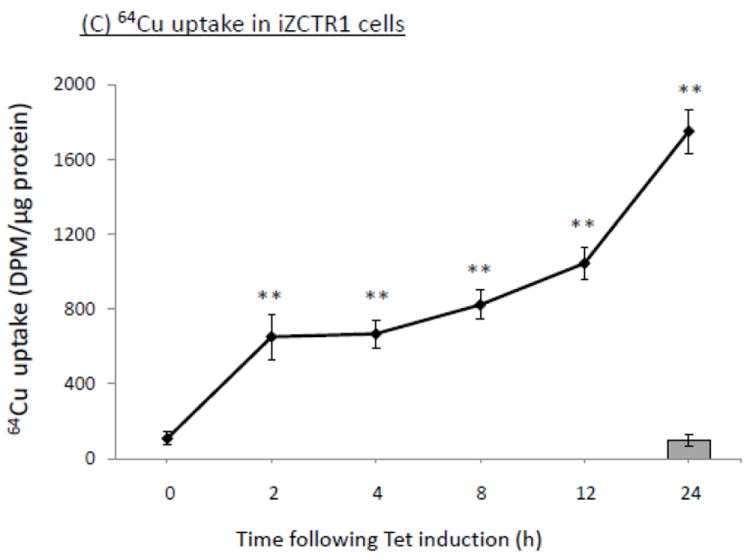
Tet-induced overexpression of CTR1 in iZCTR1 cells and the ensuing increase of cellular 64Cu uptake. The iZCTR1 cells were treated with Tet at time “0”. (A) Time course of CTR1 mRNA expression following Tet induction. Data represent mean ± SE, n=6; *: p<0.05 as compared to controls. (B) Time course of CTR1 protein level following Tet addition. (C) Time course of the cellular 64Cu uptake in iZCTR1 cells following Tet induction; the bar graph depicts the 64Cu uptake of the “normal” Z310 cells treated with Tet for 24 h (n=6). Data represent Mean ± SE, n=6. **: p<0.01 compared to controls and the Tet-treated Z310 cells.