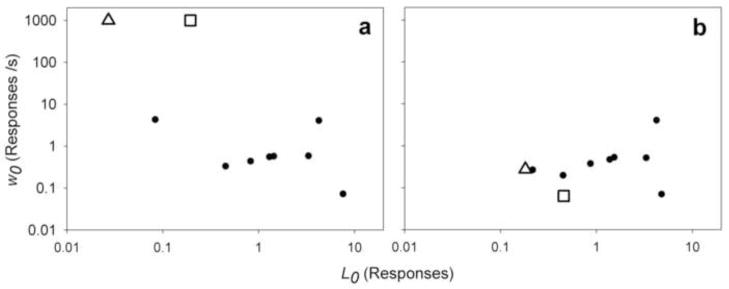
Fig. 6.
Demonstration of shrinkage by Bayesian hierarchical modeling. Rats are from the high dose group of the Cocaine example. L0: mean bout length. w0: within-bout response rate. a) Point estimates of individual parameters using maximum likelihood. Estimates of w0 are capped above at 1000 responses/s. b) Point estimates of individual parameters using Bayesian hierarchical modeling. Two outliers (white triangle and white square) are highlighted. Note that data are plotted on log-log scale due to the assumption of log-normal variability for L0 and w0.

