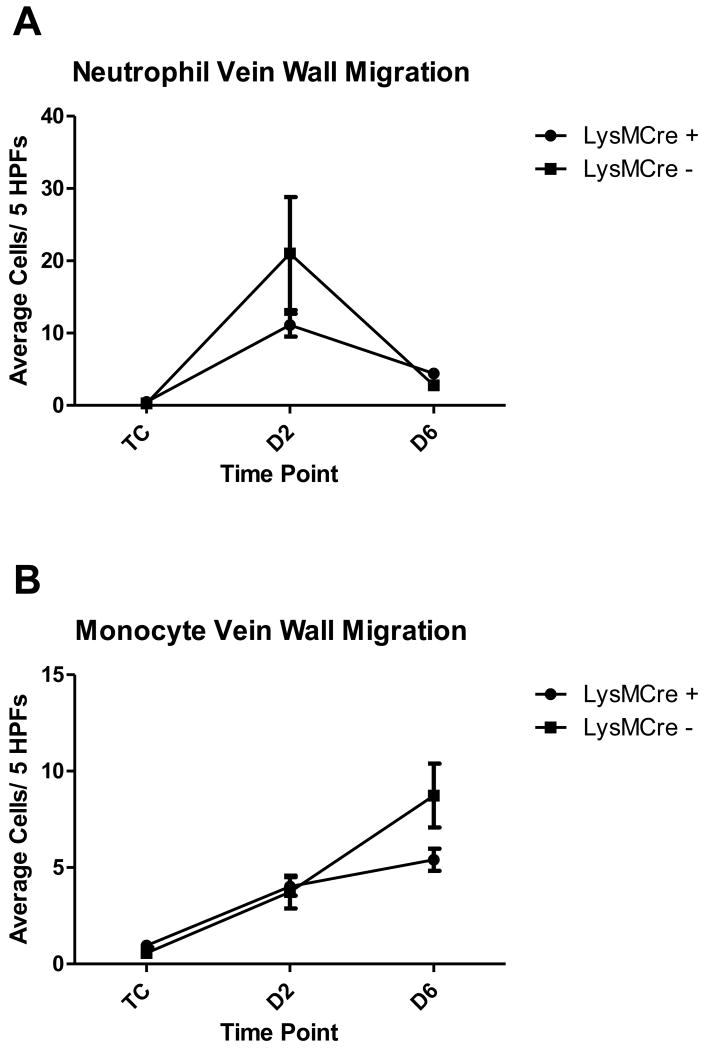
Figure 2A and Figure 2B. Vein Wall Morphometrics Composite.
average cell counts for each group (LysMCre +: n=5 for TC, n=10 for 2D and 6D thrombosis; LysMCre -: n=3 for all groups). TC=Non-thrombosed true controls, D=days post thrombosis, HPF=High power field. Both groups of mice (LysMCre + and LysMCre -) showed the same acute (neutrophil) to chronic (monocyte) inflammatory pattern. No differences were seen between the groups at any time-points.

