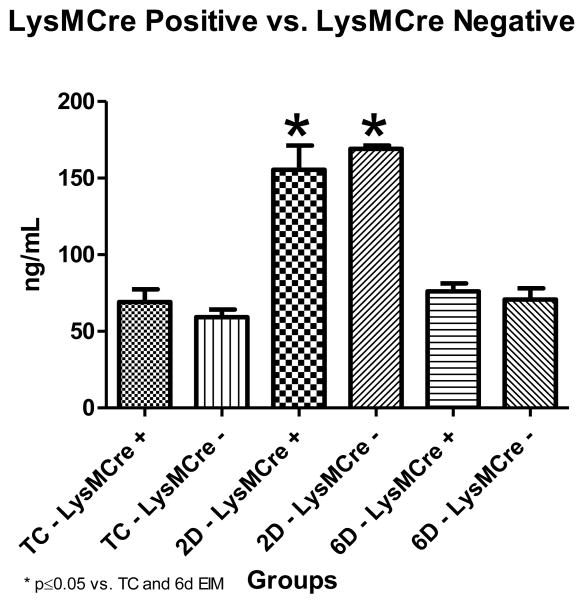
Figure 4. Plasma D-dimer.
* indicate significant differences, vs. non-thrombosed true controls and 6 days post thrombosis. (LysMCre +: n=5 for TC, n=10 for 2D and 6D thrombosis; LysMCre -: n=3 for all groups). TC=Non-thrombosed true controls, D=days post thrombosis. LysMCre + and LysMCre - mice showed a peak in D-dimer levels at day 2 which returned to baseline levels by day 6 post thrombosis. The peak fibrinolysis occurred 2 days post venous thrombosis in both LysMCre groups.

