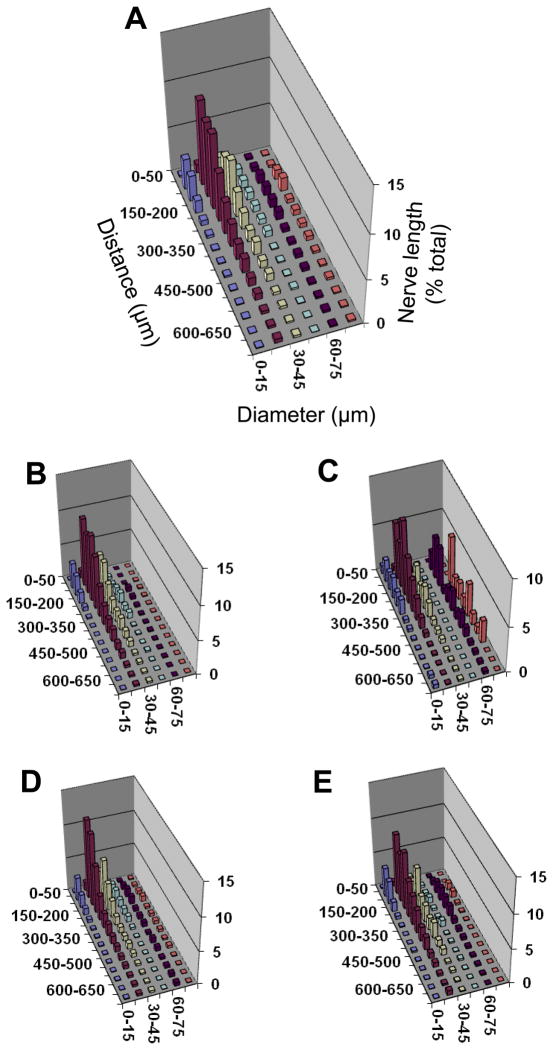
Figure 3. Proximity analyses between motor nerves and arterioles for diaphragm muscle of CD-1 mice.
Separation distance between a nerve fiber and its nearest arteriole (Z axis) expressed as percentage of total nerve length (Y axis) with respect to vessel diameter (X-axis). Relationships are shown for: A. Entire diaphragm muscle; B. Costal muscle region; C. Crural muscle region; D. Right hemidiaphragm; E. Left hemidiaphragm. Axes labels for A apply to other panels; note difference in Y-axis scales. The greatest % of nerve length is associated with vessels ≤ 45 μm diameter within a distance ≤ 250 μm. The peak for larger vessels (diameter ≥ 60–75 μm) in the crural region corresponds to entry of inferior phrenic artery into the muscle. The height of each bar corresponds to the mean of n=4 preparations. Error bars omitted for clarity; variability shown in Fig. 4.

