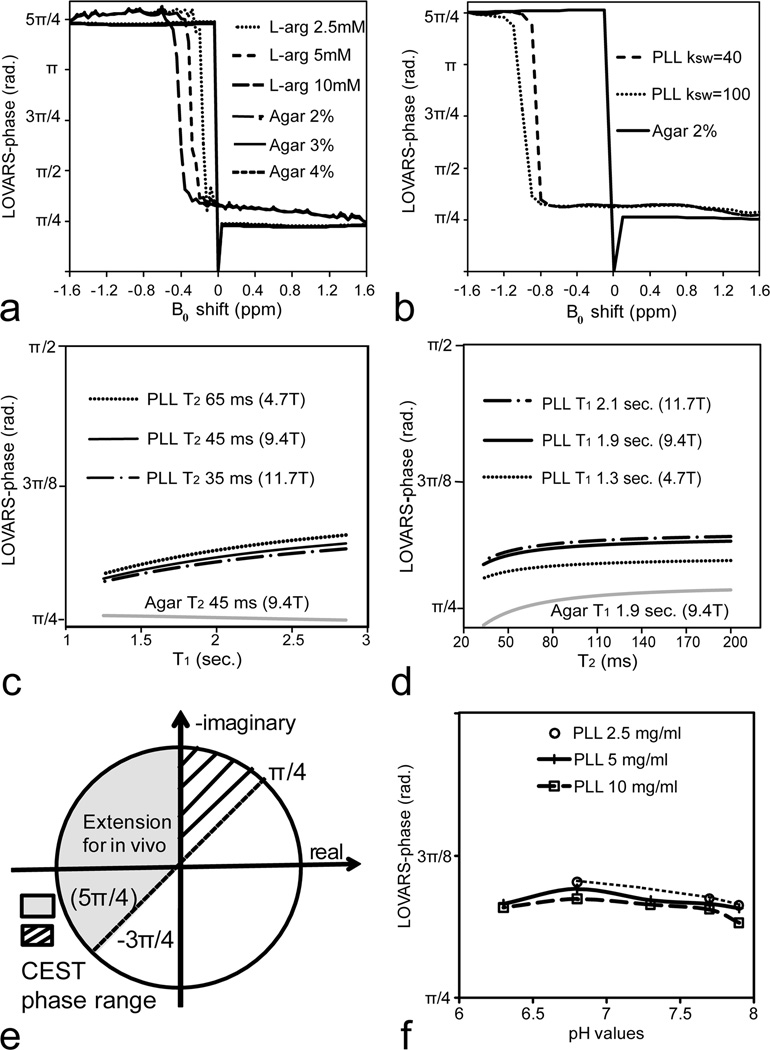
Figure 5.
a) Simulations of LOVARS phase as a function of B0 shift for L-arginine (10 mM, 5 mM, 2.5 mM) and agar (1%, 2%, 4%), Δω = ±1.8 ppm, with the resulting phase for all agar samples nearly identical. b) Simulation of LOVARS phase as a function of B0 shift for PLL (ksw = 40, 100) and 2% agar, Δω = ±3.6 ppm; c) Simulation of LOVARS phase as a function of water T1 for PLL (ksw = 40) and 2% Agar, with T2 set to the average rodent brain value found at 4.7T, 9.4T and 11.7T. d) Simulation of LOVARS phase as a function of T2 relaxation for PLL (ksw=40) and Agar 2%, with T1 set to the average rodent brain value found at 4.7T, 9.4T and 11.7T. e) Illustration of phase range restrictions suitable for determining which pixels display CEST contrast; f) LOVARS phase as a function of pH for three different concentrations of PLL(10mg/ml, 5mg/ml and 2.5mg/ml). The exchange rates varied from ~70 Hz (pH 6.4) to ~1200 Hz (pH 7.9) for these samples.

