
Fig. 1.
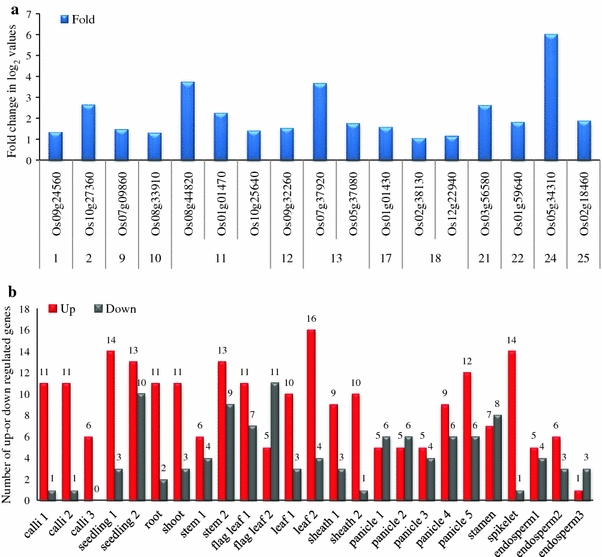
a Tissue-specific up-regulated genes in Minghui 63, the name of the tissues and the number of genes are presented to the right of the graph. The fold changes of log2 values are shown on the Y axis, and the different developmental stages and genes are indicated on the X axis. b The number of up- or down-regulated genes in different tissues under normal growth conditions in Minghui 63 is shown. The number of genes (up or down) is shown on the Y axis, and the different developmental stages are indicated on the X axis. Differentially up- or down-regulated genes at the different developmental stages are presented in Supplemental Table 2