
Fig. 2.
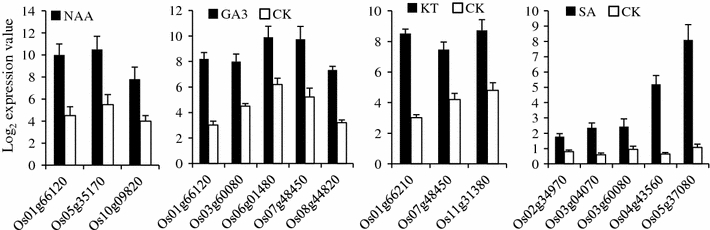
Histogram showing up-regulated OsNAC genes in seedlings subjected to treatment with four phytohormones (NAA naphthalene acetic acid, GA3 gibberellic acid, KT kinetin, SA salicylic acid). The X axis represents the differentially expressed genes. The Y axis represents the log2 expression values. The treatment is indicated at the top of each diagram. The error bars represent standard deviations. CK control or untreated samples