
Fig. 6.
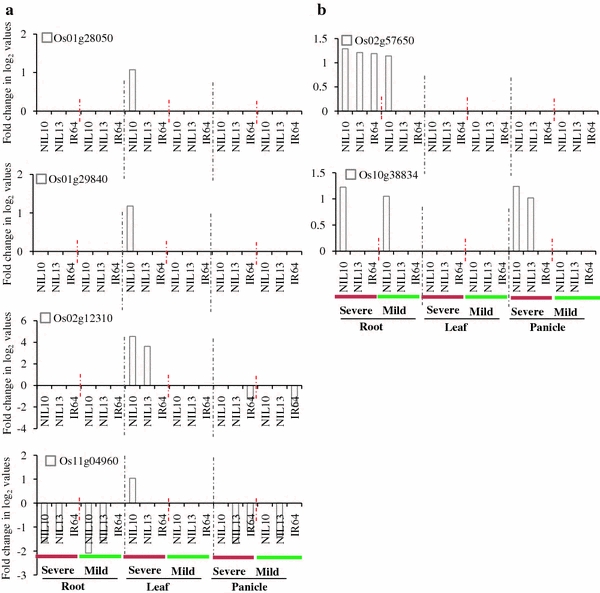
Identification of the reference genes showing the highest expression in the tolerant NIL10 compared to their counterparts under severe and mild stress a in the root and panicle and b in the leaf and panicle tissues. The fold changes in log2 values are shown on the Y axis, and the different genotypes and stress conditions are indicated on the X axis. NIL10 = IR77298-14-1-2-B-10 and NIL13 = IR77298-14-1-2-B-13