
Fig. 8.
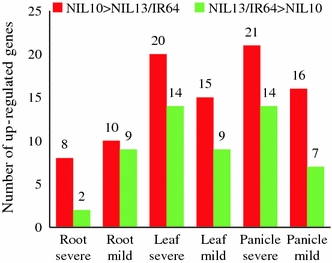
The expression intensity of up-regulated genes was higher in IR77298-14-1-2-B-10 than in IR77298-14-1-2-B-13/IR64 in all tissues under severe and mild stress conditions. The X axis represents the selected tissues and the Y axis represents number of up-regulated genes. The number of genes is indicated at the top of each diagram