Fig. 5.

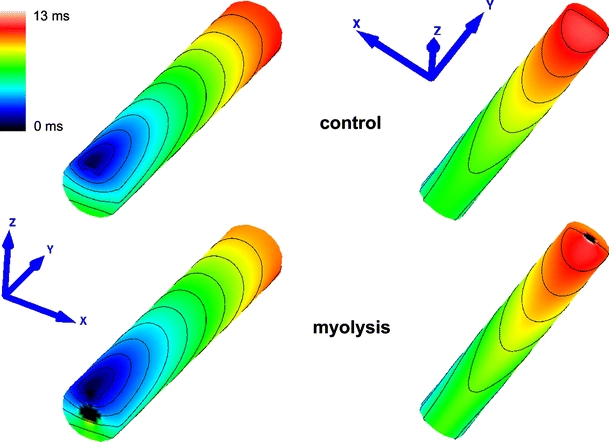
Activation sequences in the control and myolysis models (viewing upper and back sides of muscle). Activation started at the left top cusp (blue) and finished after 11.5 ms (control) and 12.9 ms (myolysis) at the right basal cusp (red)

Activation sequences in the control and myolysis models (viewing upper and back sides of muscle). Activation started at the left top cusp (blue) and finished after 11.5 ms (control) and 12.9 ms (myolysis) at the right basal cusp (red)