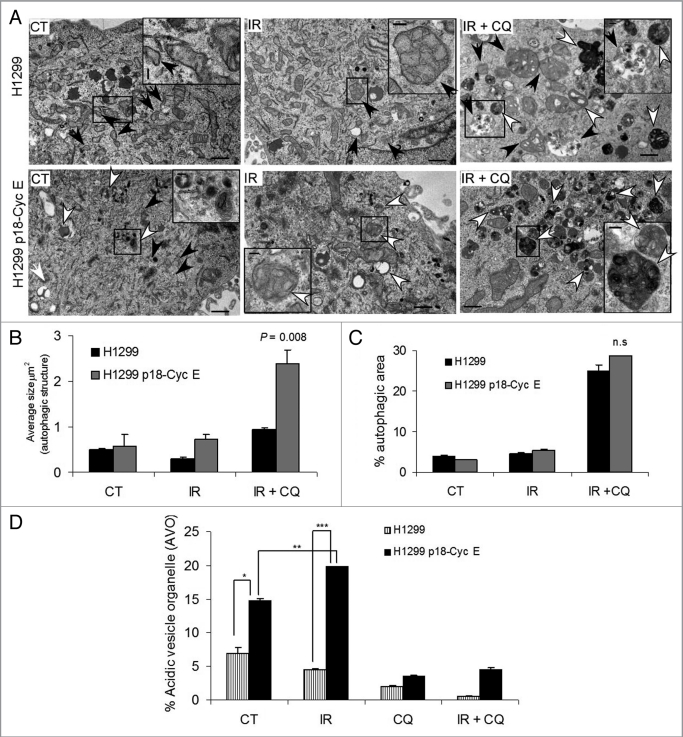
Figure 2.
Autophagic area and flux is enhanced in p18-CycE-expressing cells following DNA-damage. (A) Transmission electron microscopic analysis of autophagic structures at 24 h post irradiation in the absence or presence of chloroquine. Early and late autophagic structures are indicated by black and white arrows, respectively, with black box regions enlarged in the inset. The scale bar in the original image represents 1 µm and the scale bar in the inset represents 200 nm. (B,C) Quantitative analysis for the average size of autophagic structures (*p = 0.008) and fraction of autophagic area normalized to cytoplasmic area (n.s). Data represent means ± s.e.m., with more than three different fields analyzed per sample. (D) Detection of acidic vesicular organelles (AVOs) by measuring red and green fluorescence of acridine orange-stained cells using FACS analysis in parental and p18-CycE expressing cells at 24 h following IR and/or chloroquine treatment (*p = 0.007, **p = 0.002, ***p < 0.001). Data represent means ± s.e.m., obtained from three independent triplicates.

