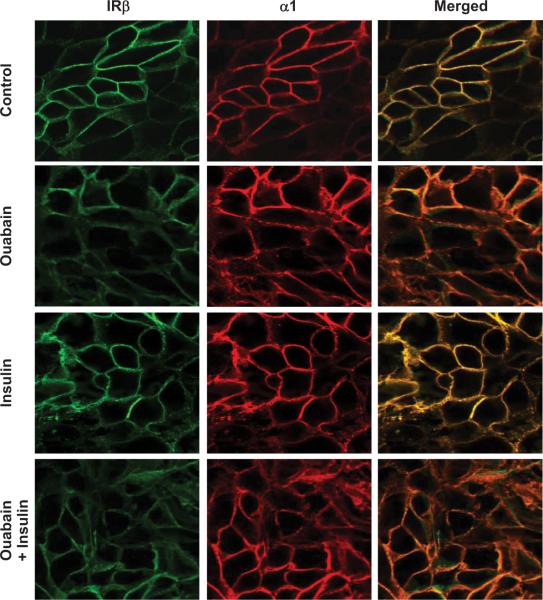
Fig. 4.
Representative images showing the cellular distribution of Insulin Receptor β subunit (green fluorescence) and Na-K-ATPase-α1 subunit (red fluorescence) following ouabain (100 nM, 1 h) and/or insulin (100 nM, 1 h) treatment in renal proximal tubule LLC-PK1 cells. Merged image shows colocalization.

