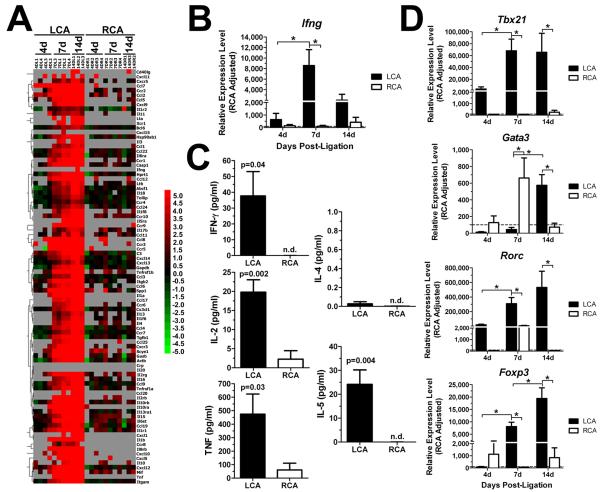
Figure 5. Dynamic changes in expression of cytokines and chemokines in LCA by disturbed flow.
A-B, D, Total RNAs obtained from LCA and RCA were analyzed by PCR cytokine arrays (A) or by qPCR (B and D). The heat map shown in (A) displays relative expression levels of cytokines and cytokine receptors in LCA compared to RCA. Green indicates downregulation, black indicates no change, and red indicates upregulation. Grey boxes indicate undetectable copy number (>35 cycles). Additional qPCR was carried out using the total RNAs to determine expression of Ifng (B) and Tbx21, Gata3, Rorc, Foxp3 (D). Shown are data for n=4 (4 and 7 day) and n=3 (14 day). C, Production of IFNγ, IL-2, TNFα, IL-4, and IL-5 proteins was determined by ELISA using 7 day post-ligation LCA and RCA stimulated ex vivo with TPA and ionomycin for 16 hr (n=5). Data are mean ±SEM. *, p<0.05. n.d., not detected.

