Figure 5.
Analysis of Leaves Exposed to High Levels of Oxalate.
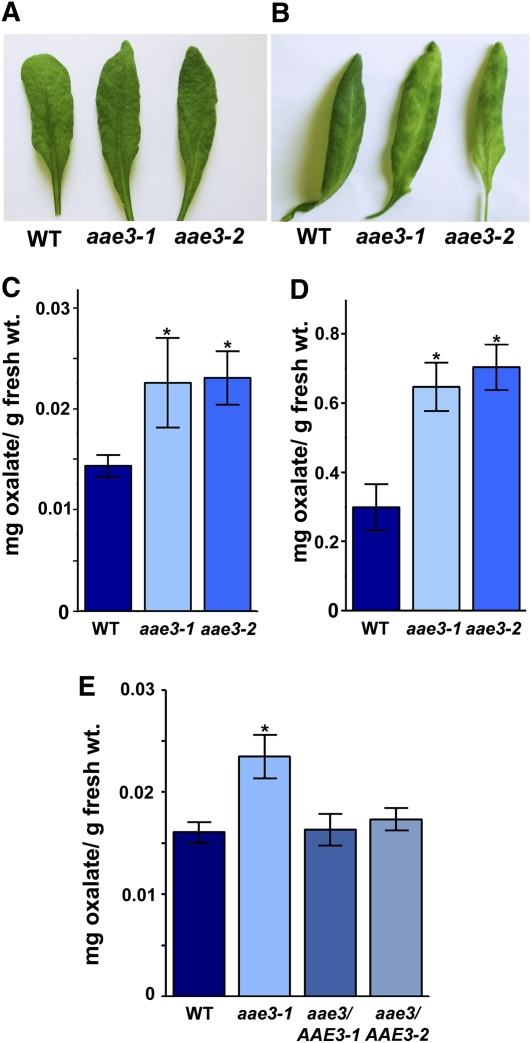
(A) and (B) Rosette leaves of 3-week-old wild type (WT), aae3-1, and aae3-2 were placed in either water for 48 h as control (A) or 10 mM oxalate for 48 h (B). The experiment was repeated three times with similar results.
(C) Samples of leaves from the experiment in (A) were removed after 24 h and oxalate content determined by HPLC. Data are mean ± se (n = 3). Asterisks denote significant difference from the wild type (*P < 0.05; Student’s t test).
(D) Samples of leaves from the experiment in (B) were removed after 24 h and oxalate content determined by HPLC. Data are mean ± se (n = 3); note different scale from (C). Asterisks denote significant difference from the wild type (*P < 0.05; Student’s t test).
(E) Oxalate content in rosette leaves of 3-week-old wild type, aae3-1, and aae3 complemented with AAE3-GFP under control of the AAE3 promoter (aae3/AAE3-1 and aae3/AAE3-2). Data are mean ± se (n = 4). Asterisks denote significant difference from the wild type (*P < 0.05; Student’s t test).

