Figure 1.
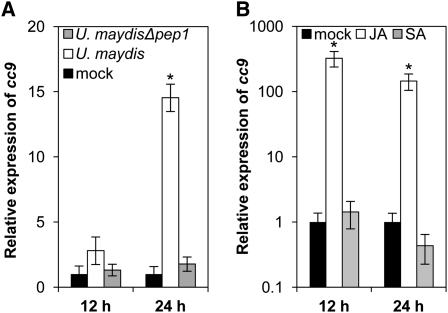
Expression Profile of cc9.
(A) Expression of cc9 was analyzed by qRT-PCR 12 and 24 h after infection of maize seedlings with U. maydis strain SG200 (white bars) or SG200Δpep1 (gray bars) compared with mock controls (black bars).
(B) qRT-PCR analysis of cc9 expression in maize seedling leaves 12 and 24 h after treatment with 2 mM SA (gray bars) or 1 mM methyl-JA (white bars) compared with mock controls (black bars). Experiments were performed in three independent biological replicates. P values were calculated by an unpaired t test. Error bars represent the se; *P < 0.05.

