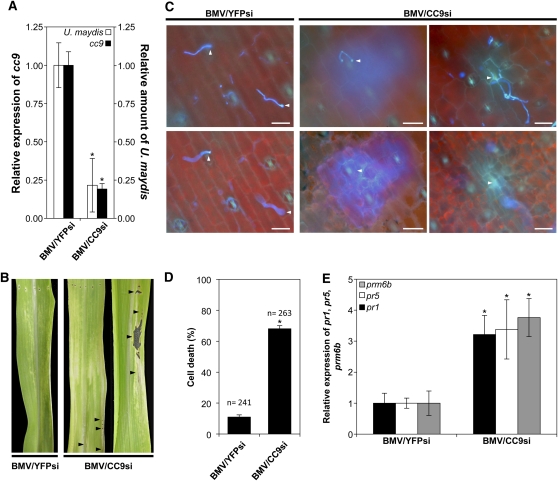
Figure 2.
cc9-Silenced Maize Plants Show a Penetration Resistance to U. maydis.
(A) Fungal DNA and cc9 expression were quantified by RT-PCR using leaf samples from cc9-silenced plants and BMV/YFPsi-infected control plants 48 h after U. maydis infection. The relative amount of U. maydis DNA (white columns) and the relative expression of cc9 (black columns) of five BMV/YFPsi control plants were averaged. Column BMV/CC9si shows mean of fungal DNA and cc9 expression of five plants. For all qRT-PCRs, the relative expression or fungal amount in control plants was set to 1. Error bars represent the se; *P < 0.05.
(B) In BMV/CC9si-infected plants, U. maydis infection results in the formation of necrotic lesions along the leaf blade, as indicated by arrowheads. Representative photographs were taken 3 d after infection with U. maydis strain SG200.
(C) Microscopy analysis of BMV/YFPsi-inoculated control plants and BMV/CC9si-inoculated plants 2 d after infection with U. maydis strain SG200. U. maydis penetration attempts are indicated by arrowheads. Bars = 25 μm.
(D) Quantification of plant cells undergoing HR after U. maydis penetration in control plants (BMV/YFPsi) and cc9 silencing plants (BMV/CC9si) 2 d after infection; error bars represent the se; *P < 0.05. Experiments were performed in three independent biological replicates. P values were calculated by an unpaired t test.
(E) qRT-PCR analysis of marker gene pr1 (black bars), pr5 (white bars), and prm6b (gray bars) expression in control (BMV/YFPsi) and BMV/CC9si plants at 2 d after infection. n = 5; error bars represent se; *P < 0.05. P values were calculated by an unpaired t test.

