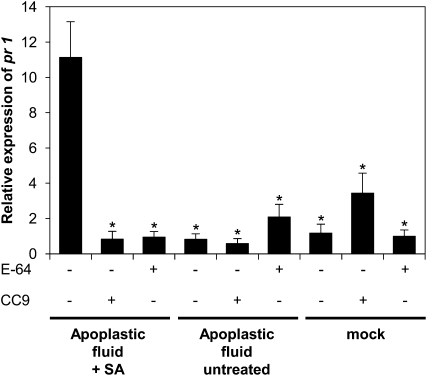
Figure 8.
pr Gene Expression in Untreated Plants in Response to Infiltration of Apoplastic Cys Proteases.
qRT-PCR analysis of pr1 after infiltration of protease-containing apoplastic fluid fractions (17.5 to 22.5 mL) from SA-treated plants, mock-treated plants, or untreated controls. n = 3; error bars represent se; P values were calculated by an unpaired t test compared with pr1 gene expression of plants treated with protease-containing apoplastic fluid fractions from SA-treated plants. *P < 0.05. The relative expression in mock-treated plants was set to 1.

