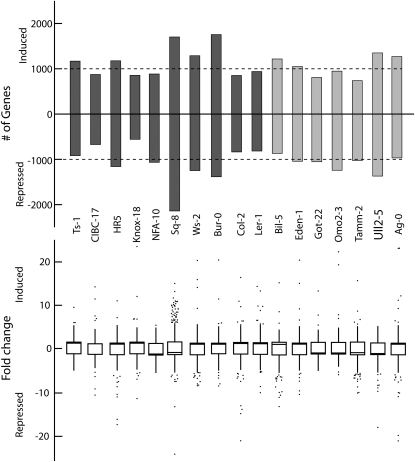
Figure 3.
Diversity of Transcriptional Response.
(A) Number of significant soil drying treatment effect genes at pFDR = 0.05 for each accession identified from one-way ANOVAs. Black boxes are Spring annual accessions; gray boxes are Winter-annual accessions. Dashed lines indicate 1000 genes on the y axis.
(B) Box plots of fold change for significant soil moisture deficit treatment effect genes in each accession. Boxes enclose 50% quantile, and dotted whiskers indicate 97.5% quantile ranges. Some extreme outliers (fold change > 25) have been omitted. n = 3 for each accession in each treatment.

