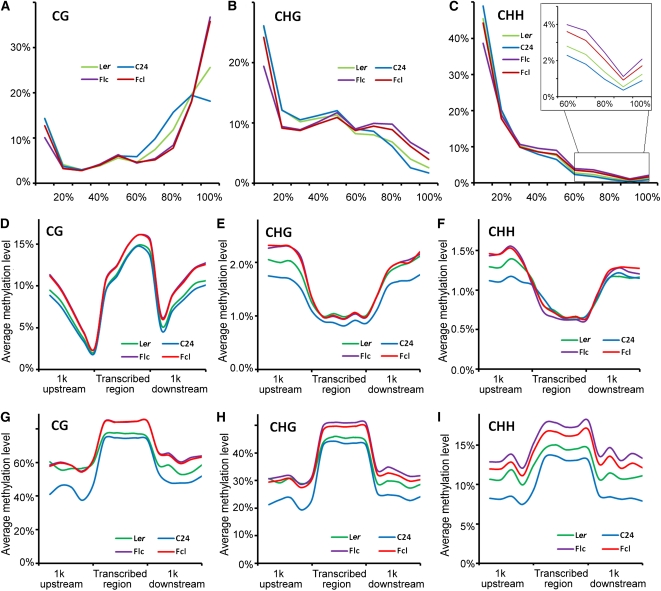
Figure 2.
Methylation Patterns of Ler and C24 Parents and Their Reciprocal Hybrids.
(A) to (C) Distribution of the percentage methylation at each cytosine context in F1 hybrids and their parents. x axis, percentage methylation in bins of 10%; y axis, percentage of total methylcytosines found in each bin. Data are averages of four independent biological replicates, each consisting of 50 pooled seedlings of the corresponding genotype.
(D) to (F) Methylation distribution in protein-coding genes at each cytosine context. x axis, position relative to the transcribed region; y axis, average methylation level (%). Data are averages of four independent biological replicates, each consisting of 50 pooled seedlings of the corresponding genotype.
(G) to (I) Methylation distribution in TEs at each cytosine context. x axis, position relative to the transcribed region; y axis, average methylation level (%). Data are averages of four independent biological replicates, each consisting of 50 pooled seedlings of the corresponding genotype.

