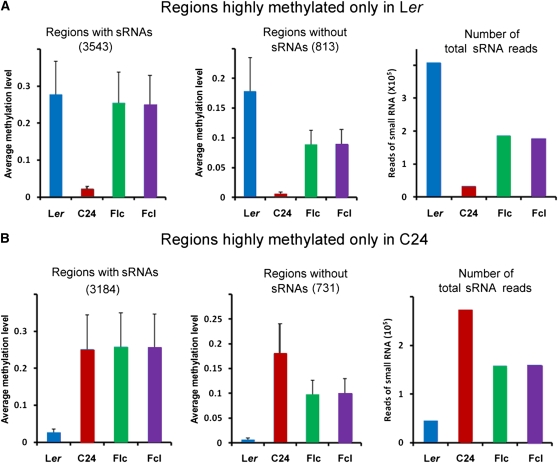
Figure 5.
sRNA Analyses of Regions That Are Differentially Methylated in the Parental Lines.
(A) sRNA analyses of regions highly methylated only in Ler. Left, average DNA methylation levels of 3543 regions covered by sRNAs (1.11 × 10⁶ bp) that were highly methylated only in Ler. Middle, average DNA methylation levels of 813 regions not covered by sRNAs (8.45 × 10⁴ bp) that were highly methylated only in Ler. Right, numbers of total sRNA reads in regions that were highly methylated only in Ler. Error bars represent sd.
(B) sRNA analyses of regions highly methylated only in C24. Left, average DNA methylation levels of 3184 regions covered by sRNAs (0.98 × 10⁶ bp) that were highly methylated only in C24. Middle, average DNA methylation levels of 731 regions not covered by sRNAs (7.64 × 10⁴ bp) that were highly methylated only in C24. Right, numbers of total sRNA reads in regions that were highly methylated only in C24. Error bars represent sd.

