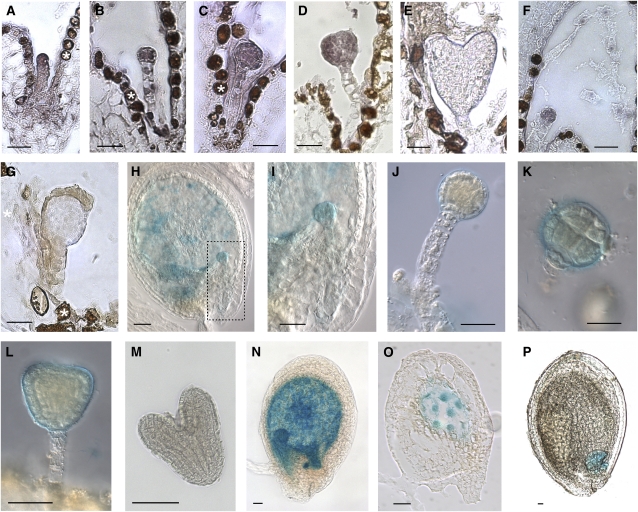
Figure 1.
CLE8 Expression Analysis in Developing Seed Tissues.
(A) to (F) CLE8 mRNA expression pattern in a one-cell stage embryo (A), a four-cell stage embryo (B), a globular stage embryo (C), a triangular stage embryo (D), a heart stage embryo (E), and in the endosperm nuclei (F).
(G) Control hybridization with a CLE8 sense probe.
(H) to (P) CLE8 promoter-driven GUS activity in embryos ([H] to [M]) and endosperm ([N] to [P]). (I) shows a higher magnification image of the embryo boxed with the dotted lines in (H).
White stars indicate background browning of the seed coat. Bars = 20 μm.

