Figure 5.
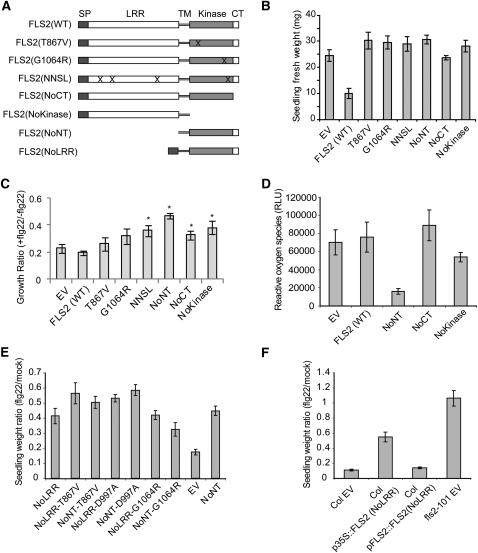
FLS2NoNT and FLS2NoLRR Have a Dominant-Negative Effect on FLS2 Function, and the Dominant-Negative Effect Is Dependent on Expression Level but Independent of Kinase Activity.
(A) Schematic of the mutated and truncated FLS2 genes tested. CT, C terminus (C-terminal 20 amino acids); Kinase, protein kinase domain; NNSL, N179D, N388D, S681L, and L1070P quadruple mutant; SP, native N-terminal export signal amino acids; TM, transmembrane domain; WT, wild type. “X” marks indicate approximate location of amino acid changes; all constructs were made in pGWB14 (see Methods).
(B) Functional test of the mutated FLS2 proteins in an fls2− genetic background, determined by seedling growth inhibition assay. All FLS2 variants (see [A]) were placed under control of the CaMV 35S promoter and transformed into Col-0 fls2-101 plants. Data for each allele are for multiple independent T1 transgenic seedlings grown in the presence of 2.5 μM flg22.
(C) Functional test of the mutated FLS2 proteins in a Col-0 (FLS2+) genetic background, determined by seedling growth inhibition assay with 2.5 μM flg22. The constructs in (A) were transformed into wild-type Col-0 plants. Similar results were obtained in three repeat experiments.
(D) Functional test of the mutated FLS2 proteins in a Col-0 (FLS2+) genetic background, determined by oxidative burst measurements. The area under the oxidative burst curve (relative luminescence units × time) was determined for each transgenic seedling; histogram shows mean ± se for eight T1 seedlings. Averaged ROS traces (luminescence over time) are shown in Supplemental Figure 3D online.
(E) Functional test of mutated FLS2 constructs transformed into Col-0 (FLS2+) genetic background, determined by seedling growth inhibition assay of T1 seedlings in 2.5 μM flg22.
(F) Functional test of FLS2NoLRR proteins with expression driven by 35S promoter or FLS2 native promoter, in a Col-0 (FLS2+) genetic background, determined by seedling growth inhibition assay of T1 seedlings in 2.5 μM flg22.
In (B) to (F), mean ± se are shown.

