Figure 3.
Structural Analysis of Wild-Type and csi1-2 Anthers.
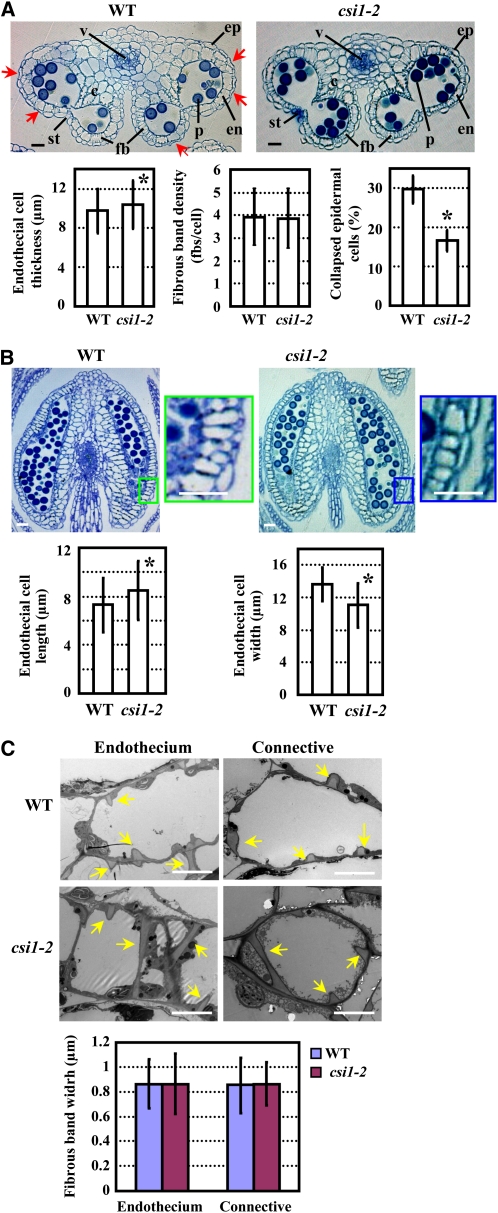
(A) Transverse sections of wild-type (WT) and csi1-2 anthers in flower buds just before opening (Top) and statistical analysis of endothecial cell thickness, fibrous band density of endothecial cells, and percentage of collapsed epidermal cells (Bottom). The collapsed epidermal cells in wild-type anthers are indicated with arrows. Statistical analysis was performed using a heteroscedastic t test (*, P < 0.01). Error bars represent se (n > 300). c, connective cells; en, endothecium; ep, epidermis; fbs, fibrous bands; p, pollen grains; st, stomium; v, vascular bundle.
(B) Longitudinal sections of wild-type and csi1-2 anthers in flower buds just before opening (Top) and statistical analysis of endothecial cell length and width (Bottom). Regions in the rectangles are enlarged and show endothecial cell shape. Statistical analysis was performed using a heteroscedastic t test (*, P < 0.01). Error bars represent se (n > 300).
(C) Transmission electron microscope analysis of endothecial and connective cells of wild-type and csi1-2 anthers. Arrows indicate the fibrous bands deposited in the endothecium and connective cells (Top). Measurement of fibrous band width (Bottom) and statistical analysis using a heteroscedastic t test showed no significant difference between the wild type and csi1-2 (P > 0.7). Error bars represent se (n > 120).
Bars in (A) and (B) = 20 μm; bars in (C) = 5 μm.

