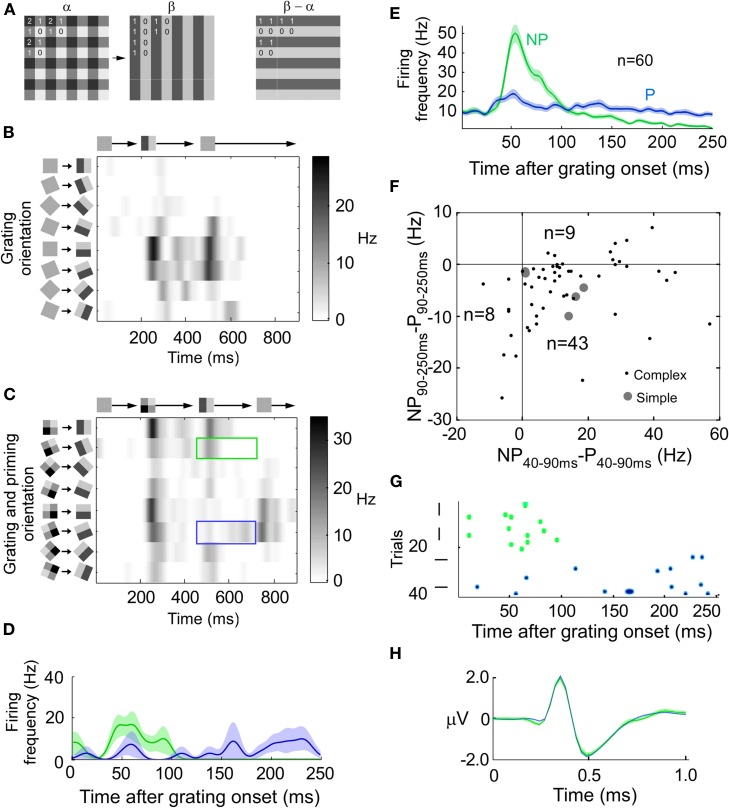
Figure 1.
Combination of a stimulus and an error-like signal across time. (A) Transition from priming to grating pattern (left). The difference (error) pattern between priming and grating pattern has a horizontal orientation (right). (B) The instantaneous firing rate for a horizontally preferring complex cell when the stimulus is rotated and displayed at eight different orientations separated by 22 1/2° (y-axis). Grating onset at 200 ms and offset at 450 ms (x-axis). (C) The response of the same unit as in B, but for the priming to pattern transition (see A). The blue (green) rectangle outline indicates when the test grating matches the preferred (non-preferred) horizontal orientation of the cell. Note that the non-preferred grating orientation now generates the largest response at around 550 ms. (D) Peri-stimulus time histogram (PSTH) of the instantaneous firing rate for stimulation with, in this example, horizontal (P: preferred, blue line, stimulus) and vertical (NP: non-preferred, green line, error) gratings after the stimulus transition (at 0 ms). The transparent field around each curve denote the standard deviation of the mean. (E) Same as (D) but the average of all 60 units. (F) Scatter plot of all units. The x-coordinate is the average firing rate during 40–90 ms after transition onset for the non-preferred orientation minus the average firing rate during 40–90 ms after transition onset for the preferred orientation. The y-coordinate is like the x-coordinate but for 90–250 ms instead of 40–90 ms. (G) Spike raster plot for the preferred and non-preferred orientations for the unit shown in B–D. (H) Extracellularly recorded spike waveform from unit in G for stimulus (blue) and error (green) spikes.

