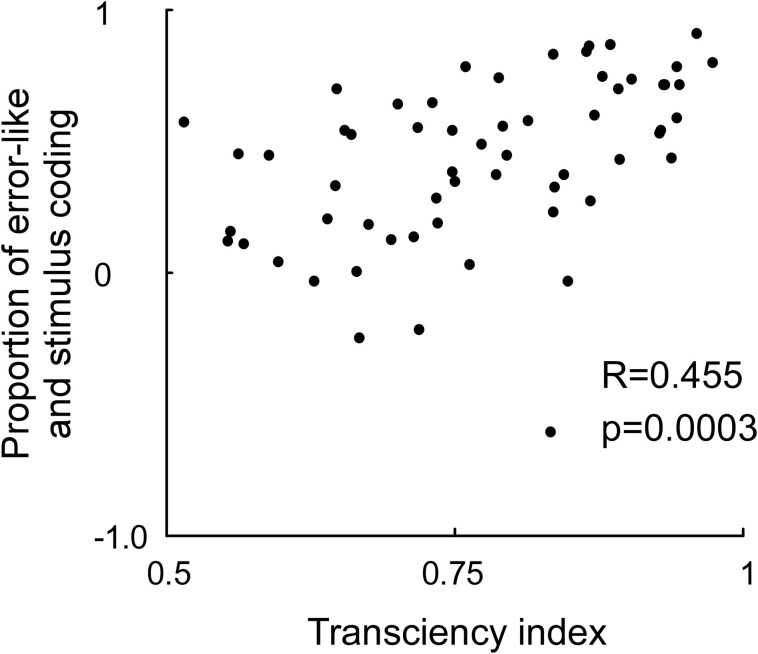
Figure 5.
Correlation between the neuronal transciency index and proportion between stimulus and error-like coding. The transciency index was calculated by dividing the firing rate between 200–250 ms by the firing rate between 40 and 90 ms in response to an optimally oriented grating preceded by a gray screen (x-axis). The proportion of stimulus and error-like coding was calculated by differentiating the firing rate for the preferred and non-preffered orientation at 40–90 ms, and divide this difference with the sum of the firing rate for the preferred and non-preffered orientation at 40–90 ms (y-axis). Note that a strong transient predicts a high proportion of error coding relative to stimulus coding.

