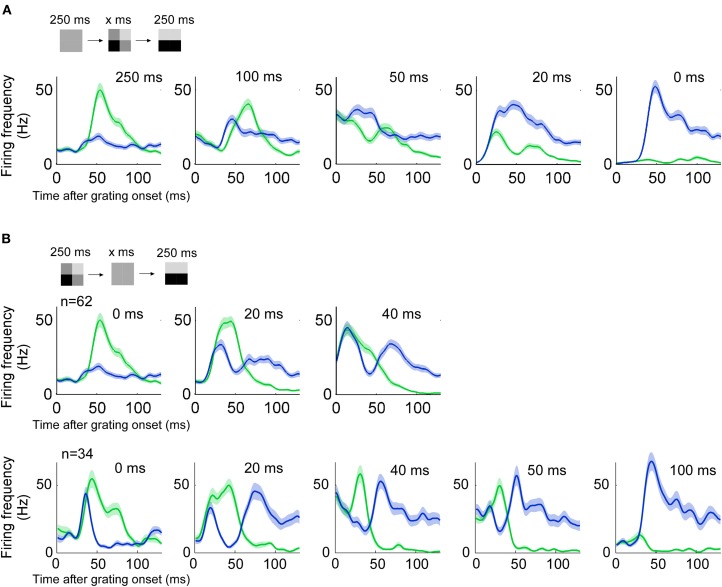
Figure 7.
History dependency. (n = 60, three animals) (A) Responses to a grating preceded by a priming image of different durations. Blue (green) lines indicate the response to a grating of preferred (non-preferred) orientation. With priming lasting 20 ms the encoded image resembles more the actual stimulus image because the response to the preferred orientation dominates. Error and stimulus are equally represented when the priming duration is around 50 ms. (B) Conventions as in A. The gap between priming and stimulus image is varied. Two animals had three different gap durations (top) and one animal had five different gap durations (bottom).

