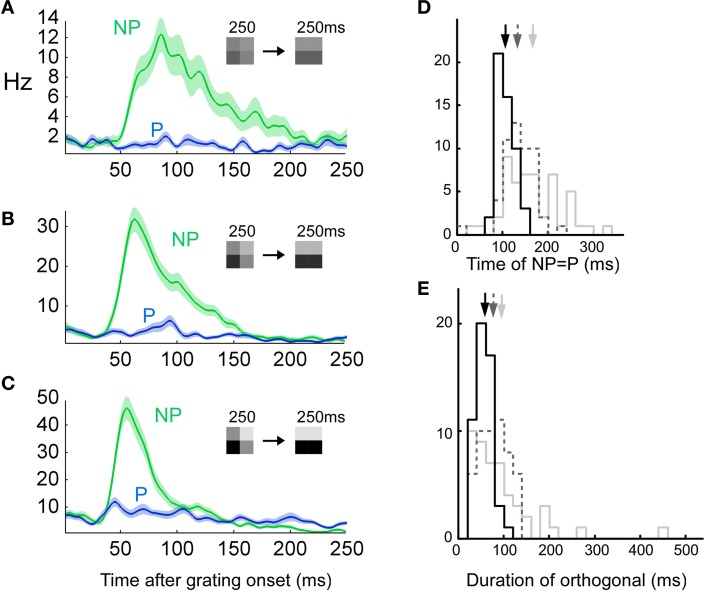
Figure 9.
Low contrast prolongs error-like signal. (n = 52, two animals) See Figure 1E for plotting conventions. (A–C) Three different contrasts were tested, i.e., 25 (priming pattern) vs. 12.5% (stimulus pattern) (top row), 50 vs. 25% (middle row) and 100 vs. 50% (bottom row). (D) The time at which the error-like coding switched to stimulus coding was calculated as the intersection between a gaussian fit to the NP and a constant fit to the P (see Methods). (E) The duration of the error-like signal was increased as a function of contrast (see Methods).

