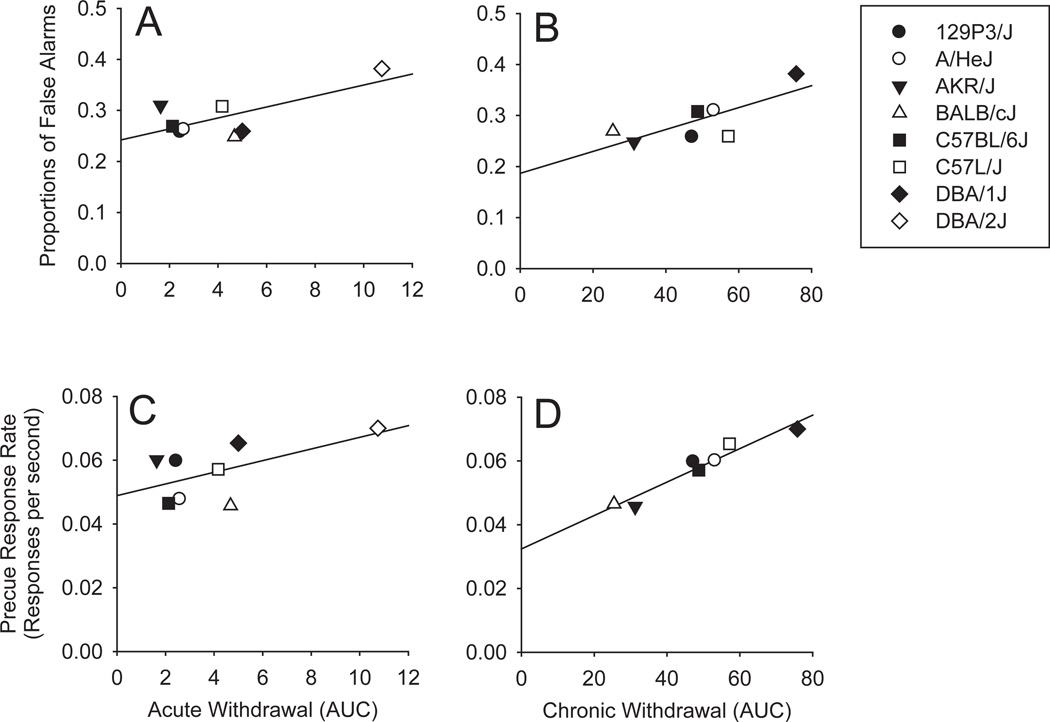
Fig. 4.
Scatterplots showing the relationships between the proportion of No-go trials on which there were false alarms and the acute and chronic withdrawal scores (A and B) and the relationships between the precue response rate and the acute and chronic withdrawal scores (C and D). Withdrawal scores were the area under the curve produced by scoring handling-induced convulsions (Crabbe et al., 1991) on an hourly basis for 25 hours following the termination of acute or chronic ethanol exposure. Acute and chronic withdrawal data were drawn from Metten and Crabbe (1994, 2005) respectively, also see Table 5 for correlations.

