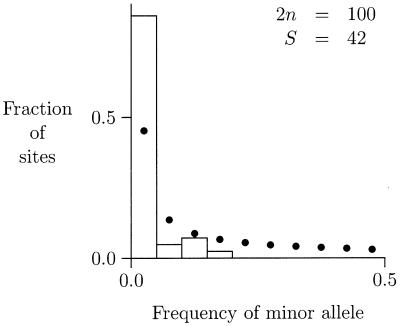
Figure 1.
Site frequency spectrum of Alonso and Armour (1). Open rectangles show the observed spectrum, with the horizontal axis aggregated into 10 bins of width 0.05. The bold dots show the spectrum expected under the infinite sites model with no selection and constant population size. 2n is the number of chromosomes sampled, S is the number of segregating sites, and the horizontal axis is the frequency of the minor (i.e., rarest) allele at a nucleotide site.

