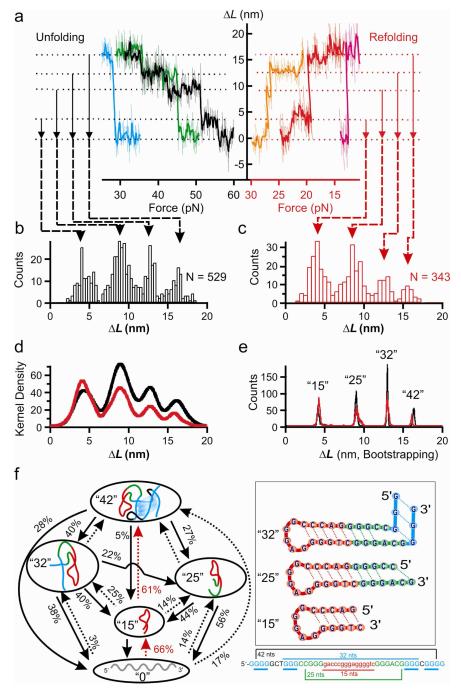
Figure 2.
Three intermediates in the sequential unfolding/refolding transitions. The ΔL-F plots for typical unfolding and refolding transitions (a). Data with 100 Hz (thin traces) and 10 Hz (thick traces) bandwidths are plotted together. Population histograms for fully folded (“42”); 32-nt (“32”), 25-nt (“25”), and 15-nt (“15”) intermediates; and fully unfolded (“0”) species are shown in (b) and (c). (d) Kernel density estimation of the unfolding (black) and refolding (red) processes. (e) Histograms (black for the unfolding and red for the refolding) of the population based on bootstrapping analyses. (f) Schematic of unfolding (black solid arrows) or refolding (dotted arrows, major pathways are highlighted with red arrows) transitions for structures (shown to the right) in the hTERT 5-12 fragment. Percentage value depicts the probability for a particular transition.

