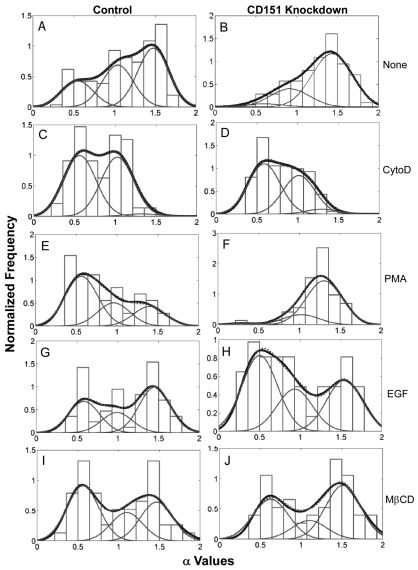
Fig. 4.
Effects of stable CD151 knockdown on α6 integrin diffusion mode. Distribution of the diffusion-mode-parameter α in control MDA-MB-231 cells (left panels) and in CD151-knockdown cells (right panels) that were untreated (A,B) or treated with cytoD (C,D), PMA (E,F), EGF (G,H) or MβCD (I,J). The thick line in each panel represents the envelope (smoothing) curve of each distribution, and was calculated using all measured α-values as described in the text. The thick curve was fit with a sum of three Gaussian curves (thin lines), which produced the dotted line. Visibility of dotted lines is partially limited because of the excellent agreement between experimental data and curve-fit data. For comparison, a histogram of the experimental data is plotted in the background. The numbers of α values included in each analysis were: A, n=181; B, n=149; C, n=100; D, n=113; E, n=50; F, n=50; G, n=59; H, n=43; I, n=53; J, n=53.

