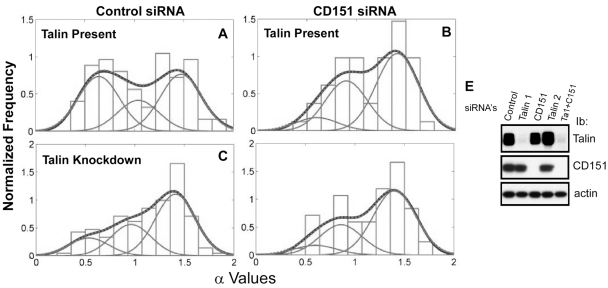
Fig. 5.
Effects of CD151 and talin siRNAs on α6 integrin diffusion mode. (A–D) Distribution of the diffusion-mode-parameter α in control-siRNA-treated MDA-MB-231 cells (left panels) and in CD151-siRNA-treated cells (right panels), which were further untreated (A,B) or treated with talin knockdown siRNA (C,D). The curve designation is as in Fig. 4. The numbers of α-values included in each analysis were: A, n=87; B, n=57; C, n=148; D, n=59. (E) Cells were treated with siRNAs to knockdown talin 1, CD151, talin 2 and talin 1+CD151. Talin 1, CD151 and actin were then western blotted from whole cell lysates.

