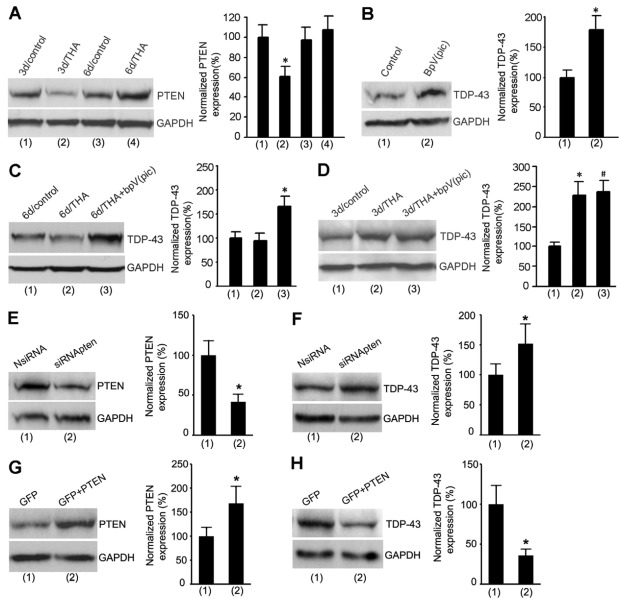
Fig. 2.
The increase of TDP-43 is mediated by PTEN downregulation soon after THA treatment. (A) Representative immunoblots (left) and summarized data (right) show that the protein expression of PTEN is decreased at 3 days after 100 μM THA treatment (n=7 for each group; *P<0.05 vs 3d/control; data are normalized to 3d/control). (B) Sample immunoblots (left) and summarized data (right) show that treatment with the PTEN inhibitor bpV(pic) (100 nM) for 24 hours increases the protein expression of TDP-43 in normal cortical neurons (n=8 for each group; *P<0.05 vs control). (C) Representative immunoblots (left) and summarized data (right) show that treatment with bpV(pic) (100 nM) at 5 days after 100 μM THA insult increases the protein expression of TDP-43 in cortical neurons at 6 days after THA insult (n=6 for each group; *P<0.05 vs 6d/THA; data are normalized to 6d/control). (D) Sample immunoblots (left) and summarized data (right) show that treatment withbpV(pic) (100 nM) at 2 days after 100 μM THA insult has no effect on the protein expression of TDP-43 at 3 days after THA insult (n=6 for each group; *P<0.05 vs 3d/control; #P>0.05 vs 3d/THA). (E) Treatment with PTEN siRNA (siRNApten) but not the non-targeting control siRNA (NsiRNA) in cultured cortical neurons suppresses PTEN expression (n=5 for each group; *P<0.05 vs NsiRNA). (F) Treatment with siRNApten but not NsiRNA increases TDP-43 expression (n=5 for each group; *P<0.05 vs NsiRNA). (G) Transfection of PTEN cDNA increases PTEN expression in cultured cortical neurons (n=4 for each group; *P<0.05 vs GFP). (H) PTEN overexpression reduces TDP-43 expression in cultured cortical neurons (n=4 for each group. *P<0.05 vs. GFP). All bar graphs show means ± s.e.m.

